Next: E-Mail Up: Kaspersky Previous: Workareas Contents
Several statistics are displayed in this interface:
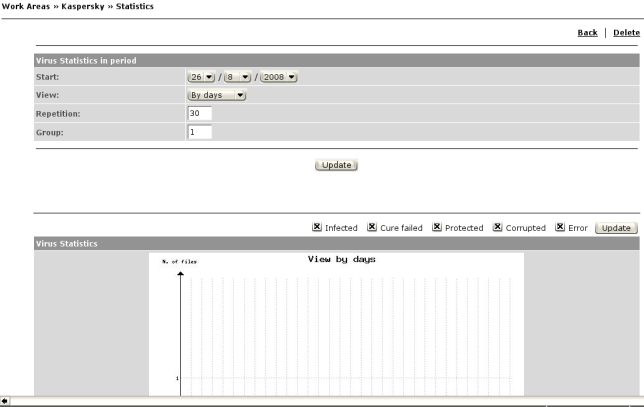
Virus Statistics in period: Options of displaying Virus Statistics (Figure 3.42):
Start: The starting date for statistics;
View: Can be set to hours, days, months or years;
Repetition: Scale of the graph's horizontal axis;
Group: It enables you to group data, depending on the chosen view
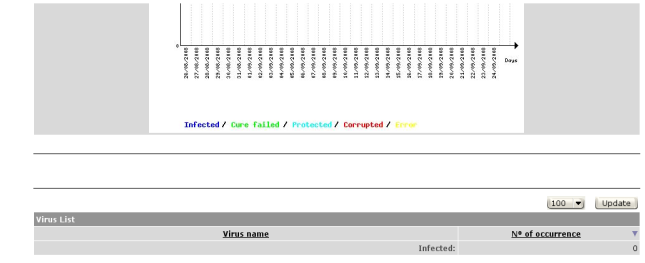
Vírus statistics: The display can be filtered by: Infected files, protected, corrupted, errors and files where disinfection failed;
Virus list: Can be organized by Virus name/Number of occurrences (Figure 3.43).