Next: VPN Up: Kaspersky Proxy Previous: Configure Contents
Several statistics are displayed in this interface:
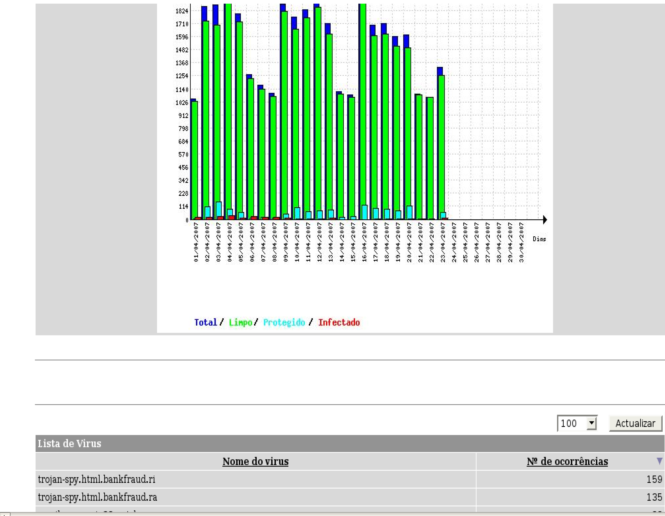
Virus Statistics in period: Options to display present graphic in Virus Statistics:
Start: The starting date for statistics;
View: Can be set in hours, days, months or years;
Repetition: Scale of the graphic horizontal axis;
Group: It enables you to group data, depending on the chosen view
Vírus statistics: The display can be filtered by: Infected files or protected;
Virus list: Can be organized by Virus name/Number of occurrences.
An example can be viewed at Figure 4.17